
Figure 2.
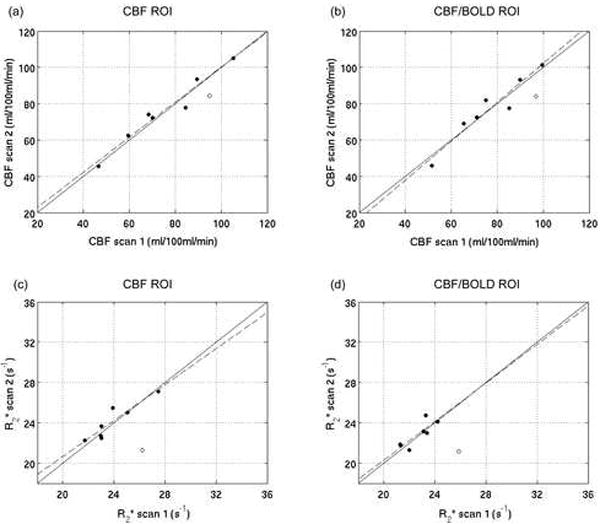
Comparison of the subject-wise baseline CBF and R2* values measured pre and post-caffeine for the CBF ROI (a, c) and the CBF/BOLD ROI (b, d). The identity lines are shown in solid black.
Official websites use .gov
A
.gov website belongs to an official
government organization in the United States.
Secure .gov websites use HTTPS
A lock (
) or https:// means you've safely
connected to the .gov website. Share sensitive
information only on official, secure websites.
Comparison of the subject-wise baseline CBF and R2* values measured pre and post-caffeine for the CBF ROI (a, c) and the CBF/BOLD ROI (b, d). The identity lines are shown in solid black.