
Figure 3.
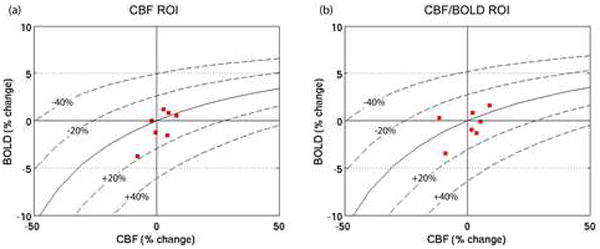
Subject-wise BOLD vs. CBF responses to hypercapnia (green), visual stimulation (blue) and caffeine (red) within (a) the CBF ROI, and (b) the CBF/BOLD ROI. The solid black line shows the contour for zero CMRO2 change, and the dashed lines show the contours for ±20%, ±40% CMRO2 changes. The contours are calculated using the mean M value for the group (see Table 1; corresponding CMRO2 changes with mean M are shown in Figures 4(c) and 4(d)).