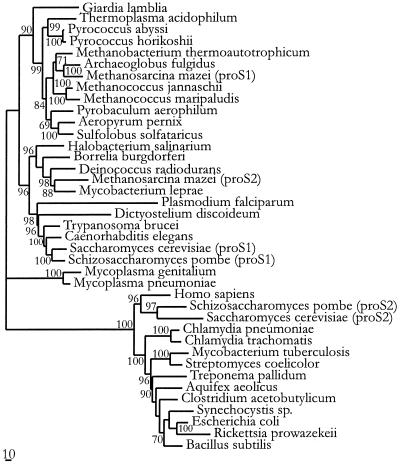
Figure 4.
Phylogenetic tree of ProRS sequences inferred by protein ML analysis. This tree is rooted using threonyl-tRNA synthetase sequences as an outgroup (not shown). Some eukaryotic sequences are distinguished as mitochondrial (mito) or cytoplasmic (cyt). Bootstrap probabilities for each node are estimated by the resampling estimated log-likelihood method. The scale bar represents 10 substitutions per 100 amino acid positions.

