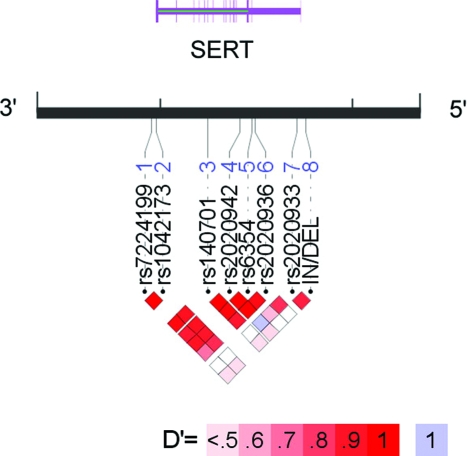
Figure 1.
Linkage disequilibrium (LD) structure of SERT. Pairwise LD between loci (D′ and r2) and haplotype structure were measured using Haploview 4.0. (Broad Institute; Cambridge, MA).23 LD was measured using the in/del and seven SNPs genotyped in the control subjects in this study. The strength of LD is depicted graphically for each pairwise comparison (squares), such that white and blue represent low levels of LD, and red indicates high levels of LD (see color key). The SNPs are identified by their RS numbers and displayed relative to the candidate gene region. The display range of the chromosome (black line) corresponds to the genomic region of SERT. Exon/intron structure of the genes is indicated by thick/thin purple lines according to genome assembly hg17/May 2004. Note that the RefSeq uses the complementary strand of DNA; thus, the promoter region (5′) is on the right. Annotated graphical images were generated using into LocusView 2.0 (Broad Institute; Cambridge, MA).30

