
Figure 2.
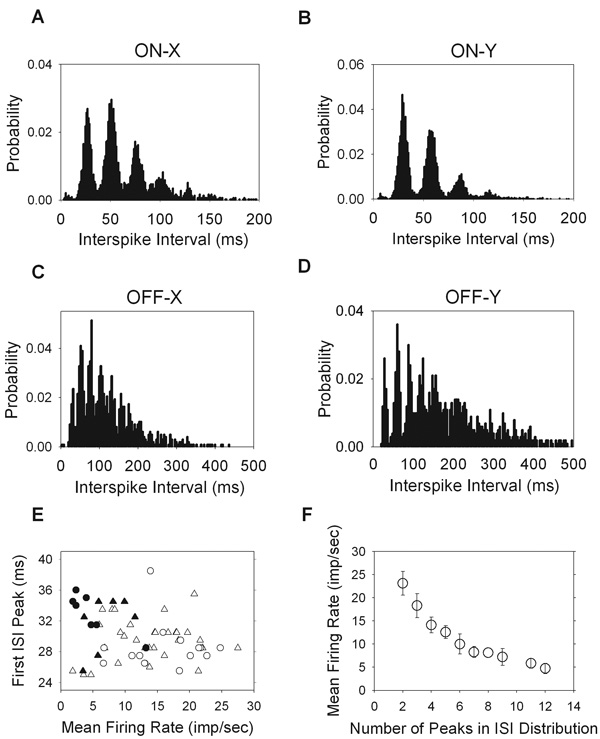
Multi-modal interspike interval distributions for all cell types. For ON cells (A, B) the bin size is 1ms, and for OFF cells (C, D) the bin size is 4ms. E. The mean firing rate of each cell is plotted against the interspike interval at which the first peak occurred. F. The number of peaks in each interval distribution is plotted against the mean firing rate of each cell (ON-X, open trianlges; ON-Y, open circles; OFF-X, filled triangles; OFF-Y, filled circles).