
Figure 3.
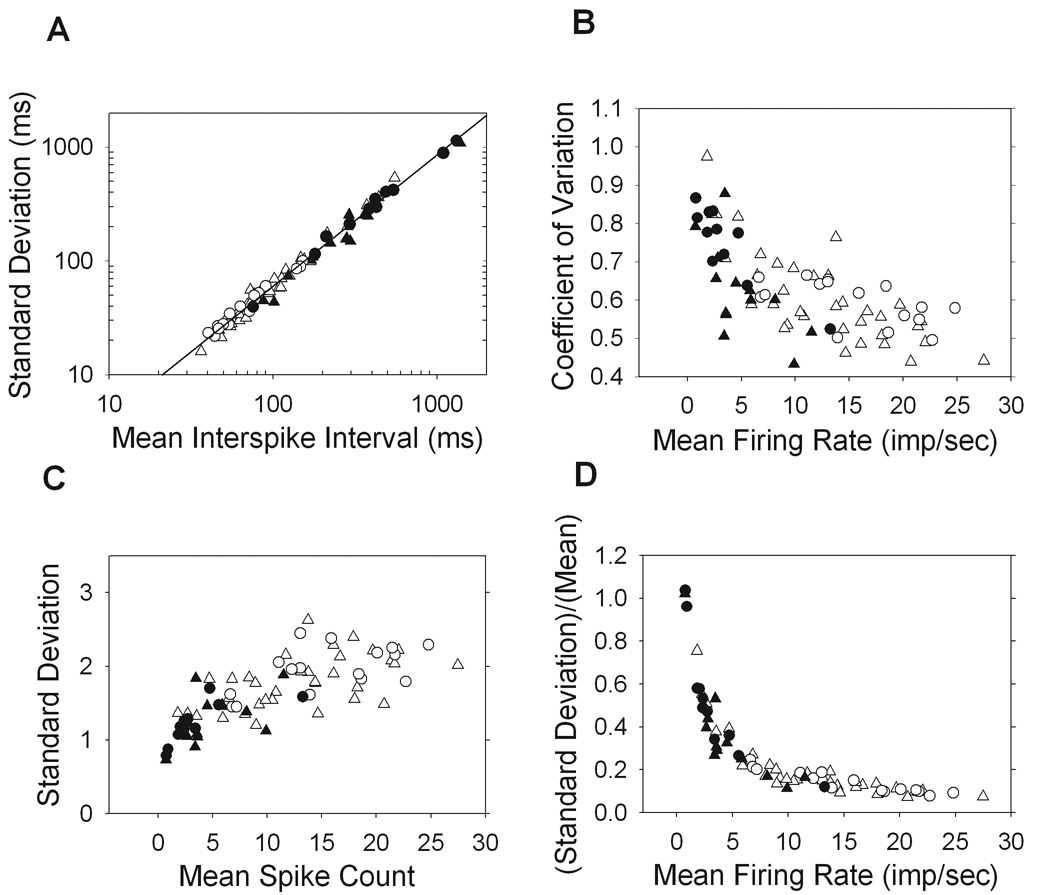
Interval and spike count statistics. A. The standard deviation of interspike intervals in the maintained discharge of each cell is plotted against the mean interval, where the line shown is the best fit with slope of 1.17 and y-intercept of −0.557 (r = 0.997). B. The coefficient of variation, or the standard deviation of intervals normalized by the mean interval, is plotted against the mean firing rate of each cell. C,D. The spike count, which is the number of spikes occurring in 1sec windows, is averaged across the maintained discharge of each cell and plotted against the standard deviation (C) as well as the standard deviation normalized by the mean (D). (ON-X, open trianlges; ON-Y, open circles; OFF-X, filled triangles; OFF-Y, filled circles).