
Figure 4.
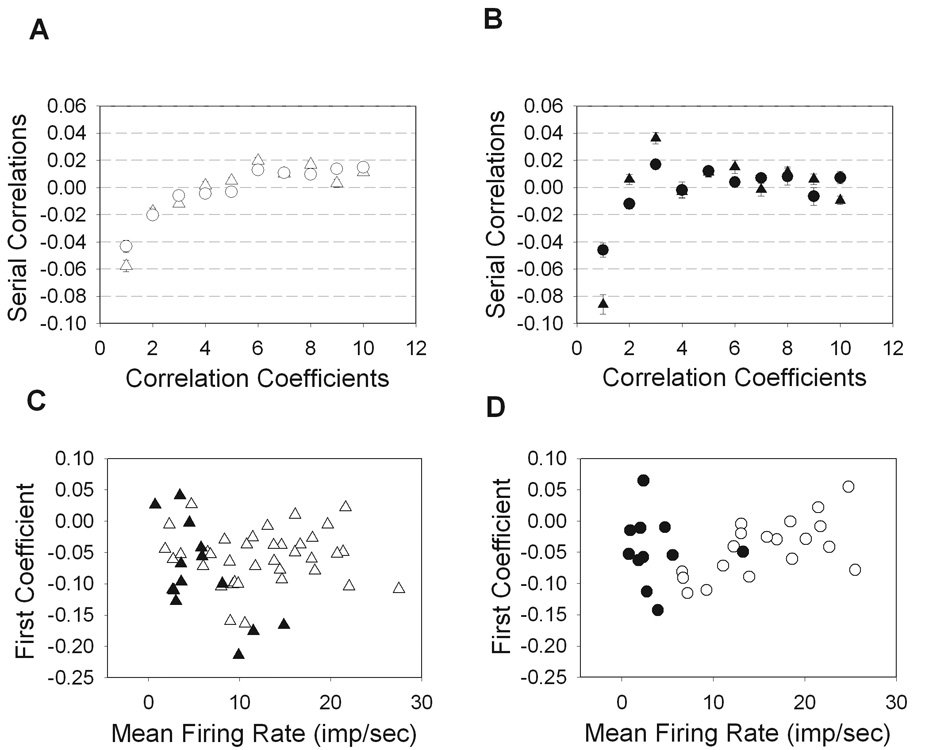
Serial correlations among interspike intervals. The magnitude of serial coefficients 1–10 were averaged over all ON cells (A) and OFF cells (B) where all cells show negative 1st order correlations and ON-cells also showed significant 2nd order correlations (P<0.05). The first correlation coefficient is plotted for all X-cells (C) and Y-cells (D). (ON-X, open trianlges; ON-Y, open circles; OFF-X, filled triangles; OFF-Y, filled circles).