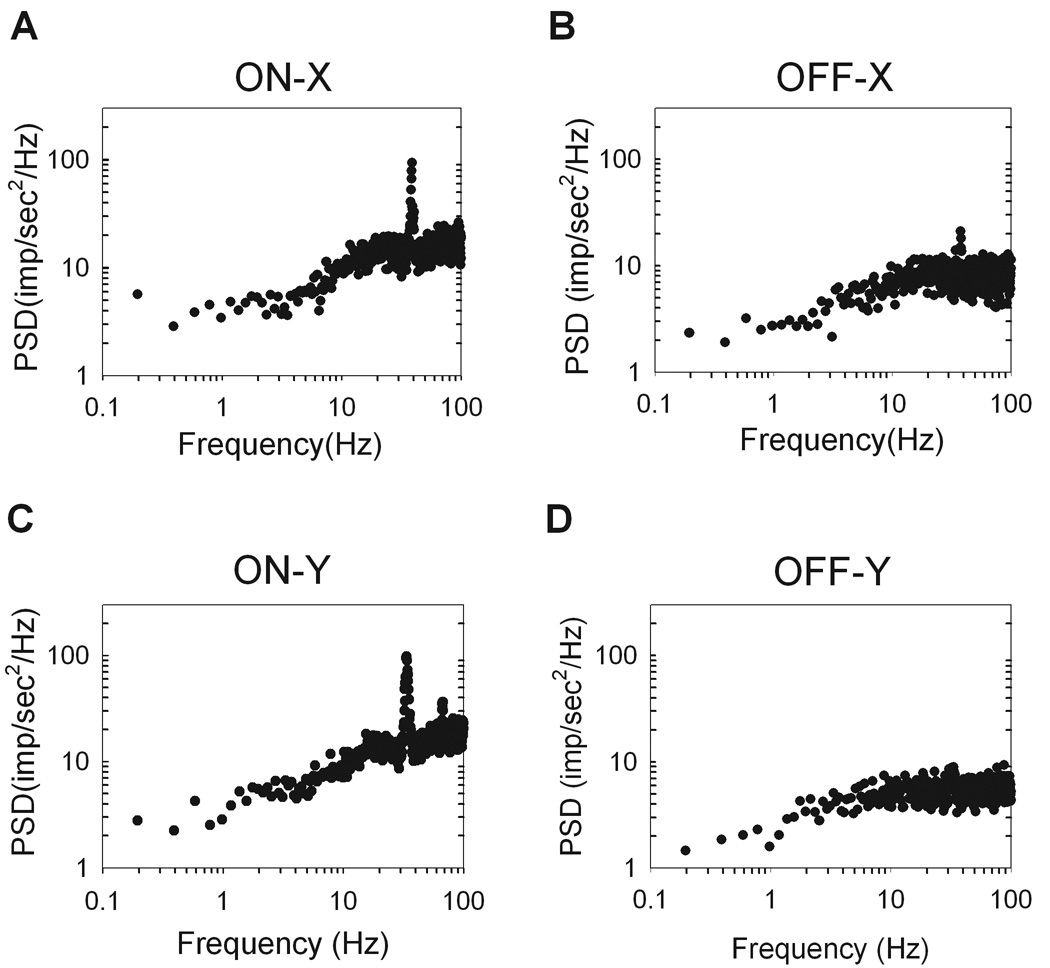
Figure 5.

Power spectral densities (PSD) of the spike trains are plotted for each cell type. The power density is flat at low frequencies and ramps up to a value equal to the mean rate of the cell. A. ON-X cell (R81C2), mean rate: 16.1 imp/sec. B. ON-Y cell (R77C4), mean rate: 18.6 imp/sec. C. OFF-X cell (R92C11), mean rate: 8.1 imp/sec. D. OFF-Y cell (R64C8), mean rate: 6.8 imp/sec. High frequency peaks are clearer in the ON cells (A,C) than the OFF cells (B,D). The units of power density is in (impulses/sec)2 per unit Hz.
