
Figure 6.
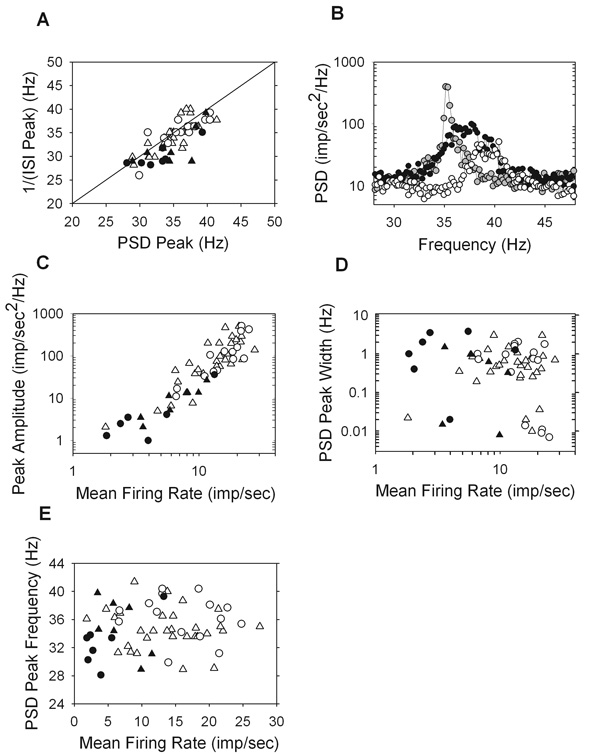
Properties of the high frequency peak in the power spectral density (PSD). A. The peak frequency of the PSD versus the inverse of the first peak of the interspike interval (ISI) distribution where the points are clustered around a line of unity slope (r = 0.76). B. Zooming in on the high frequency peaks and plotting on a linear scale for three ON-Y cells, two of which are from the same animal (R94C2, white and R94C6, gray) and one from a separate animal (R92C1, black). The mean firing rate versus amplitude (C) and width (D) of the high frequency peak, as well as versus the peak frequency (E). (ON-X, open trianlges; ON-Y, open circles; OFF-X, filled triangles; OFF-Y, filled circles).