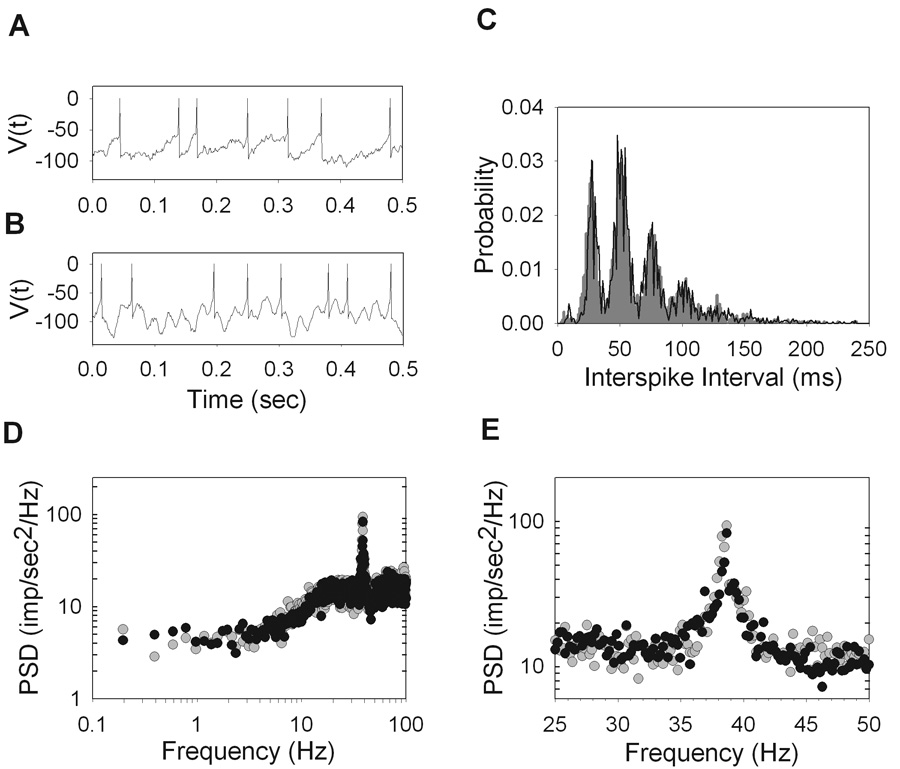
Figure 9.

Modified integrate-and-fire model. The output, V(t), is shown for the case where Iosc=0 (A) and for the case where there is an oscillatory drive (B). C. The interval distribution of an example ON-X cell (R81C2) (gray) is shown along with the best fit interval distribution of the model (black). D. The corresponding power spectra of the spike trains that produced the interval distributions shown in C. of the model to the interval distribution in C (black) for an. The high frequency peak of the power spectrum is zoomed in and plotted on a linear scale (E). The best fit parameters are fosc=38.6, µ=710, σ=2650, σphase=29, A=3750, Vth=−55, and Vreset=−95.
