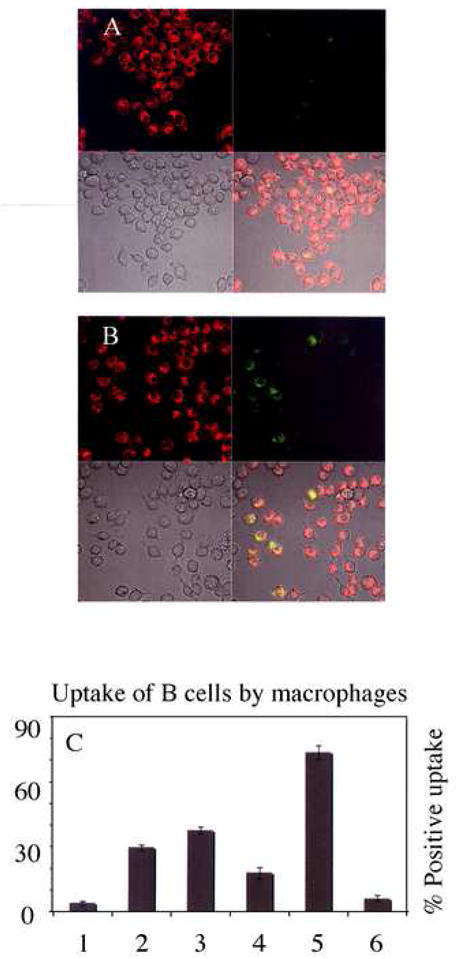
Fig 3.

Macrophage uptake of PS expressing cells. (A) Control. No Electric field (B) Field treated B-cells. E ~ 2.1 kV/cm, ~ 200 μSec. See Results section for description of frames in each panel. (C) Percentage of macrophages positive for uptake under conditions shown: Lanes 1- Control; 2-Field exposed; 3-Field exposed + Annexin I; 4-Field exposed + Annexin V blocked; 5-Ca+2 ionophore treated for 12 hrs; 6-Field exposed + 12 hrs incubation. Error bars represent the standard error.
