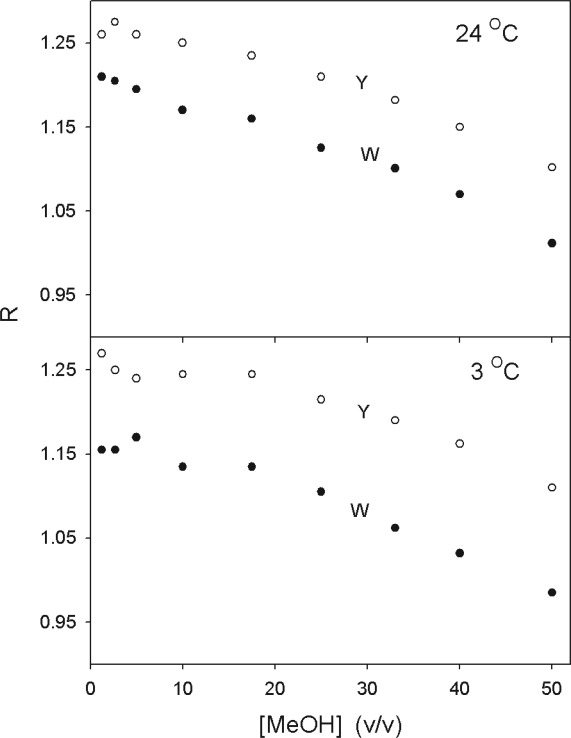
Figure 2.
The R-values of both tryptophan-emphasis and tyrosine-emphasis, obtained from derivative absorption spectra, are a function of the solvent polarity and temperature. The upper panel (24 °C) shows the evolution of R for both tryptophan and tyrosine emphasis as a function of the concentration of methanol. The lower panel shows the evolution of R as a function of methanol concentration at 3 °C.

