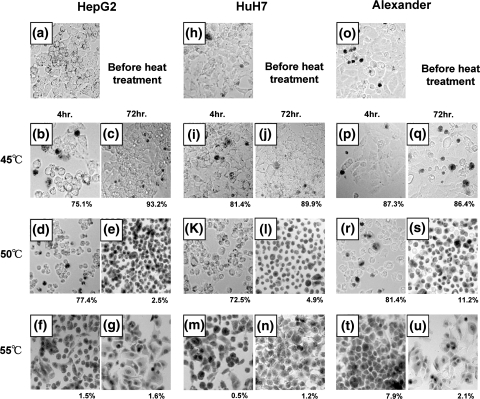
Fig. 3.
Evaluation of effects of heat treatments on HCC cells by Trypan blue dye exclusion test. The ratios of alive cell numbers in total HCC cells were calculated. (a) HepG2 before heat treatment. (b, c) HepG2 4 and 72 h after 45°C treatment. (d, e) HepG2 4 and 72 h after 50°C treatment. (f, g) HepG2 4 and 72 h after 55°C treatment. (h) HuH7 before heat treatment. (i, j) HuH7 4 and 72 h after 45°C treatment. (k, l) HuH7 4 and 72 h after 50°C treatment. (m, n) HuH7 4 and 72 h after 55°C treatment. (o) Alexander before heat treatment. (p, q) Alexander 4 and 72 h after 45°C treatment. (r, s) Alexander 4 and 72 h after 50°C treatment. (t, u) Alexander 4 and 72 h after 55°C treatment

