Figure 13.
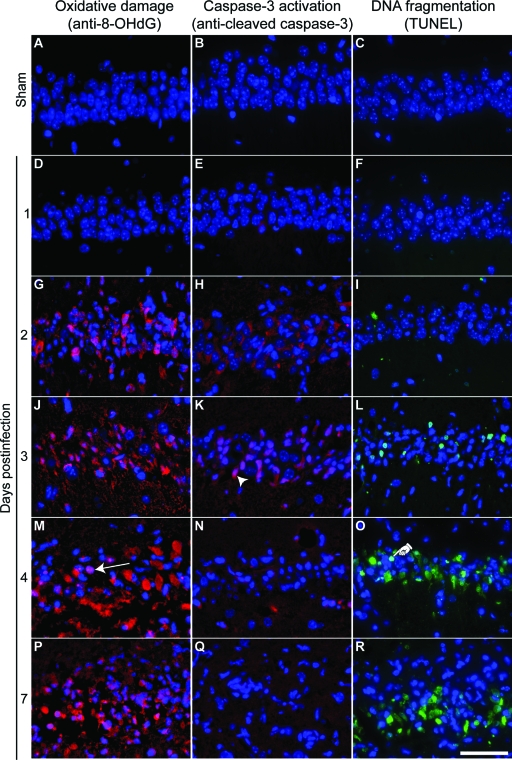
Hippocampal injury during acute TMEV infection is associated with apoptotic markers. Higher magnification images of the same areas of CA1 analyzed in Figure 8. A, D, G, J, M, P: Oxidative damage assessed by anti-8-OHdG immunostaining (red). B, E, H, K, N, Q: Activated caspase-3 immunoreactivity (red). C, F, I, L, O, R: TUNEL staining to show DNA cleavage (green). A–C: The CA1 region of sham-infected animals shows no evidence of oxidative damage (A), activated caspase-3 (B), or TUNEL positivity (C) at 7 dpi. D–R: In contrast, mice infected with TMEV show a time-dependent increase in oxidized nucleotides, activated caspase-3, and DNA cleavage. The arrow in (M) indicates a typical anti-8-OHdG-positive pyramidal neuron. The arrowhead in (K) indicates a typical activated caspase-3-positive pyramidal neuron. The hand in (O) indicates a typical TUNEL-positive pyramidal neuron. The day of maximum caspase-3 activation (H or K) precedes the onset of maximum DNA cleavage (O and R), while the onset of oxidative damage (G) is contiguous with caspase-3 activation. Scale bar = 50 μm (in R and applies to all panels). These results are representative of at least five mice in each of three separate experiments. DAPI-labeled nuclei are blue in all panels.

