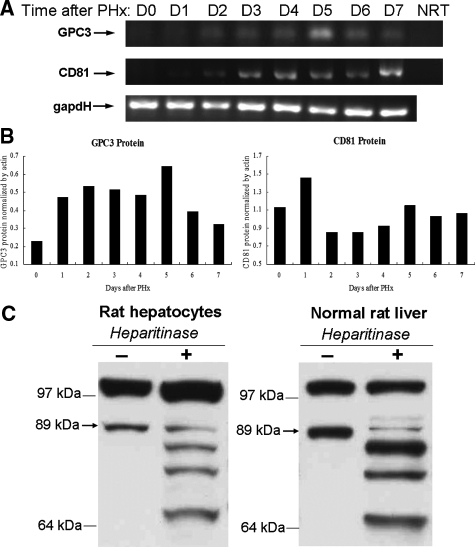
Figure 1.
RNA and protein levels of GPC3 and CD81 increase during liver regeneration. A: Semiquantitative RT-PCR results show that GPC3 and CD81 expression are up-regulated in PHx after day 2. GAPDH: loading control. NRT: non-RT negative control. B: GPC3 and CD81 protein levels, normalized by actin, increase from day 2 after PHx with a peak expression at day 5. C: Western blotting results of GPC3 protein extract from freshly isolated normal rat hepatocytes and normal rat liver tissue treated with heparitinase to eliminate HS chains. See details in Materials and Methods. The arrow indicates the 89-kd glycosylated form of GPC3.

