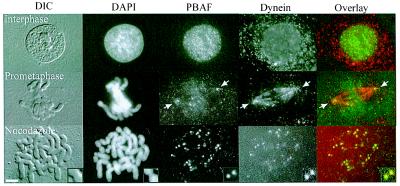
Figure 5.
PBAF localizes at mitotic kinetochores and spindle poles. Immunofluorescence micrographs of cells in interphase (Top), prometaphase without nocodazole (Middle), and prometaphase in 10 μM nocodazole (Bottom). The small inserts in the lower right-hand corners of the bottom row illustrate colocalization of PBAF and dynein at an enlarged kinetochore. The kinetochore that appears in the zoomed Inset is marked by a box in the image obtained from differential interference contrast light microscopy (DIC). DNA was visualized by 4′,6-diamidino-2-phenylindole (DAPI) staining. In the overlay column, green represents PBAF staining and red represents dynein. The arrows indicate the spindle poles. Scale bar = 5 μm.

