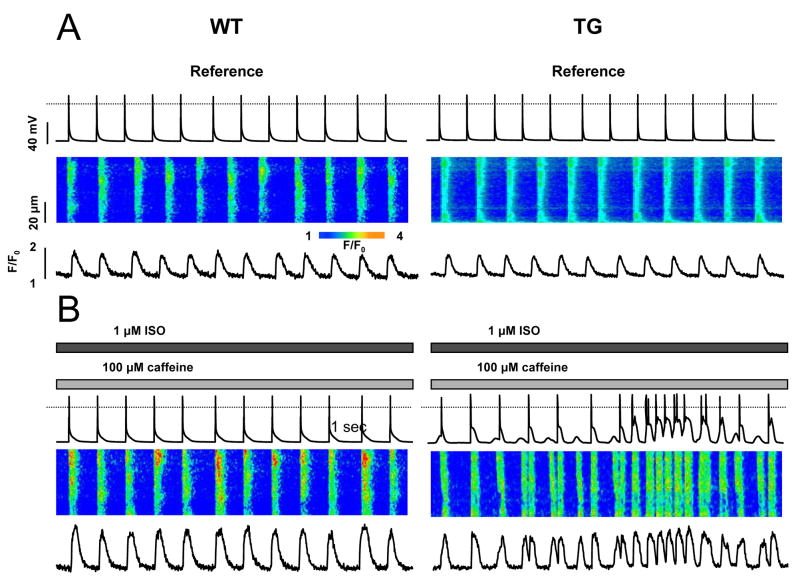
Fig. 5. TG myocytes (6-fold CASQ2D307H) show spontaneous Ca2+ transients.
Recording of membrane potential (top traces), along with line-scan confocal images (middle traces) and temporal profiles (bottom traces) in myocytes before (A) and after superfusion (B) with 1 μM of ISO and 100 μM of caffeine.

