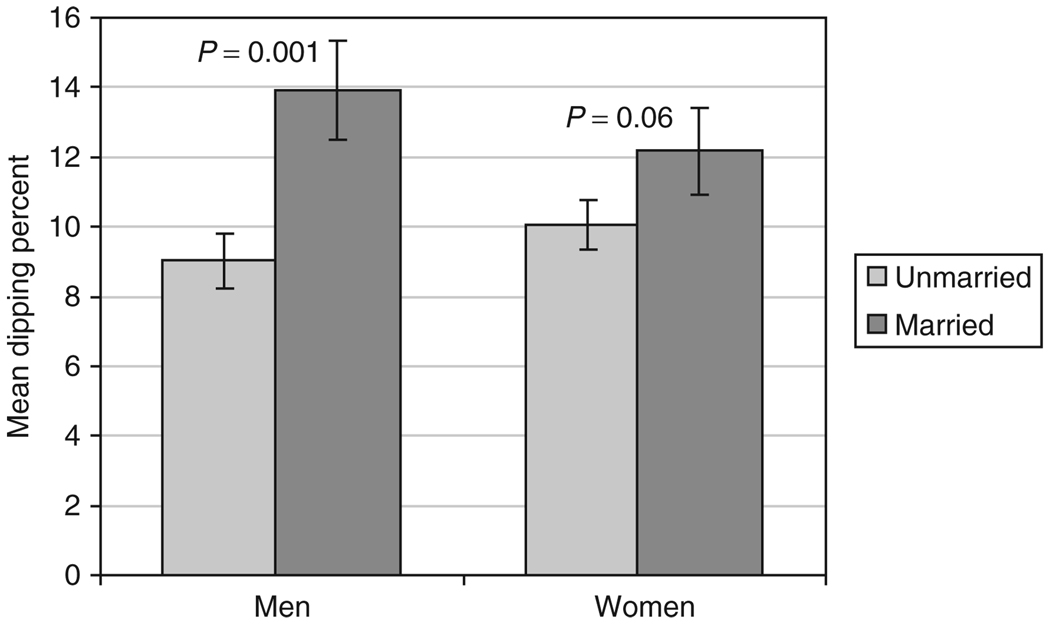
Figure 2.
Mean blood pressure dipping percentage by marital status and sex. The sex × marital status interaction was marginally significant (P = 0.11). The figure shows the mean dipping percentage for each group, adjusted for age, body mass index, mean 24-h systolic blood pressure, race, and education. P values in the figure represent the significance of the effect of marital status in men and women separately.

