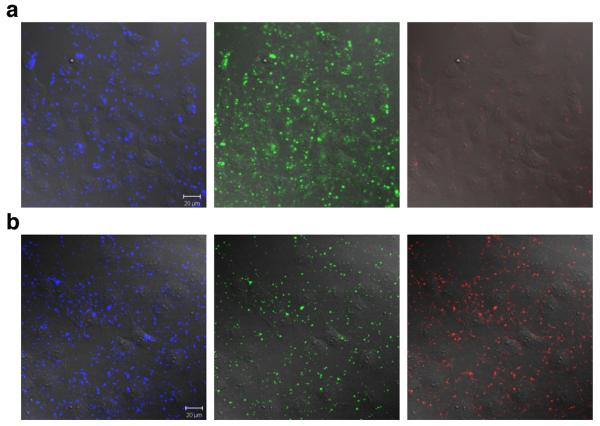
Figure 3.
Cellular studies corresponding to the in vitro ones in Figure 2. a Atto425-BSA-biotin + 1-Streptavidin; b Atto425-BSA-biotin + 1-Streptavidin + 2-avidin. Overlay of fluorescence and DIC images of cells. Blue channel 480-520 nm, green channel 565-615 nm, and red channel 640-704 nm; all excited at 458 nm. Images were collected after 10 min incubation at 37 °C with the FRET donor, washing, and another 10 min incubation at 37 °C with the acceptors. Scale bar is 20 μm.

