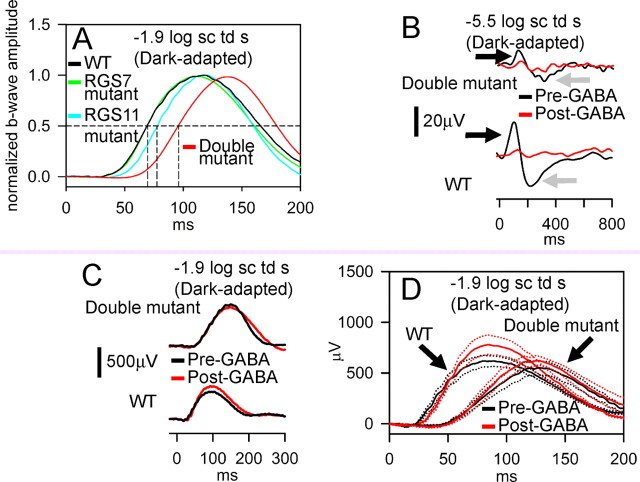
Figure 11.
Additive effects of RGS7 and RGS11 gene disruptions on time course of the dark-adapted ERG responses arising from bipolar cells. A, Averaged ERG responses for WT (includes animals either homozygous WT or heterozygous for either RGS7 or RGS11, black, n = 14), RGS7 mutant (green, n = 4), RGS11 mutant (cyan, n = 9) and RGS7+RGS11 double mutant (red, n = 4) normalized to the maximal ERG amplitude for −1.9 log sc td s flash. Horizontal dashed line, Half-max amplitude; vertical dashed lines, time for half-max b-wave for the different traces (for WT and RGS7 mutant, 69.5 ms; RGS11 mutant, 77.5 ms; RGS7+RGS11 mutant, 96 ms). B, Dark-adapted ERG response recorded from representative subjects for a low energy flash of −5.5 log sc td s showing abolition of p- and n-STRs (black and gray arrows respectively) following intravitreal injection of GABA (red traces) for both RGS7+RGS11 double mutants (double mutant, black trace, top) and WT (wild type, black trace, bottom). C, Dark-adapted ERG response recorded from representative subjects for a flash energy of −1.9 log sc td s. Intravitreal injection of GABA (red traces) did not significantly alter the time course of the leading edge on the b-wave for either RGS7+RGS11 double mutants (black trace, top) or WT (black trace, bottom). D, Averaged dark-adapted ERG responses recorded for a flash energy of −1.9 log sc td s. WT, Wild type; double mutant, RGS7+RGS11 double mutants; red traces, after intravitreal injection of GABA; black traces, before intravitreal injection of GABA. Dotted traces indicate ±1 SEM. Number of animals: WT = 3; double mutants = 6.

