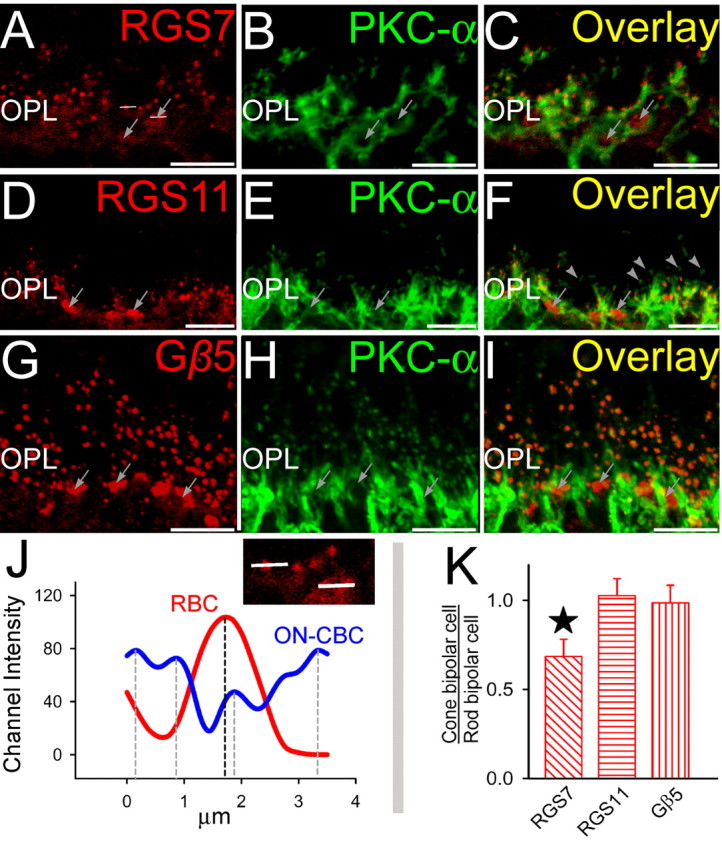
Figure 3.

Double staining for GAP proteins and rod bipolar cell marker PKCα. Double labeling using antibodies directed against RGS7, RGS11, and Gβ5 (red) and PKC-α (green). A–C (Radial section), The punctuate staining for RGS7 (A) in the OPL colocalized with labeling for PKC-α (B) at the dendritic tips of rod bipolar cells as seen from the overlay (C). Clusters of RGS7 staining (arrows) indicate their presence in cone bipolar cells. The horizontal lines are representative channel intensity graphed in figure J. D–F (Radial section), The punctuate staining for RGS11 (D) in the OPL colocalized with labeling for PKC-α (E) at the dendritic tips of rod bipolar cells as seen from the overlay (F). Clusters of RGS11 staining (arrows) indicate their presence in cone bipolar cells. Some rod-bipolar cell dendritic tips were devoid of detectable staining for RGS11. G–I (Radial section), The punctuate staining for Gβ5 (G) in the OPL colocalized with labeling for PKC-α (H) at the dendritic tips of rod bipolar cells as seen from the overlay (I). Clusters of Gβ5 staining (arrows) indicate their presence in cone bipolar cells. J, Typical channel intensity profiles for rod and cone bipolar cell dendritic tips. Intensities were measured along white lines in A across a rod dendritic tip and a cluster of cone bipolar cell dendritic tips. Rod bipolar cells had a discrete single peak, whereas cone-bipolars (being closely packed) showed multiple peaks. The peak channel intensity profiles are indicated by dashed vertical lines. K, Average peak channel intensity profiles (across 70 channel intensity profile values for each antigen) for cone bipolar tips as a ratio of peak intensities for rod bipolar cells (across 70 channel intensity profile values) for RGS7, RGS11, and Gβ5. Statistically significant difference is indicated by the star above the vertical bar (paired t test; p > 0.01). Scale bar, 20 μm. ONL, Outer nuclear layer; INL, inner nuclear layer.
