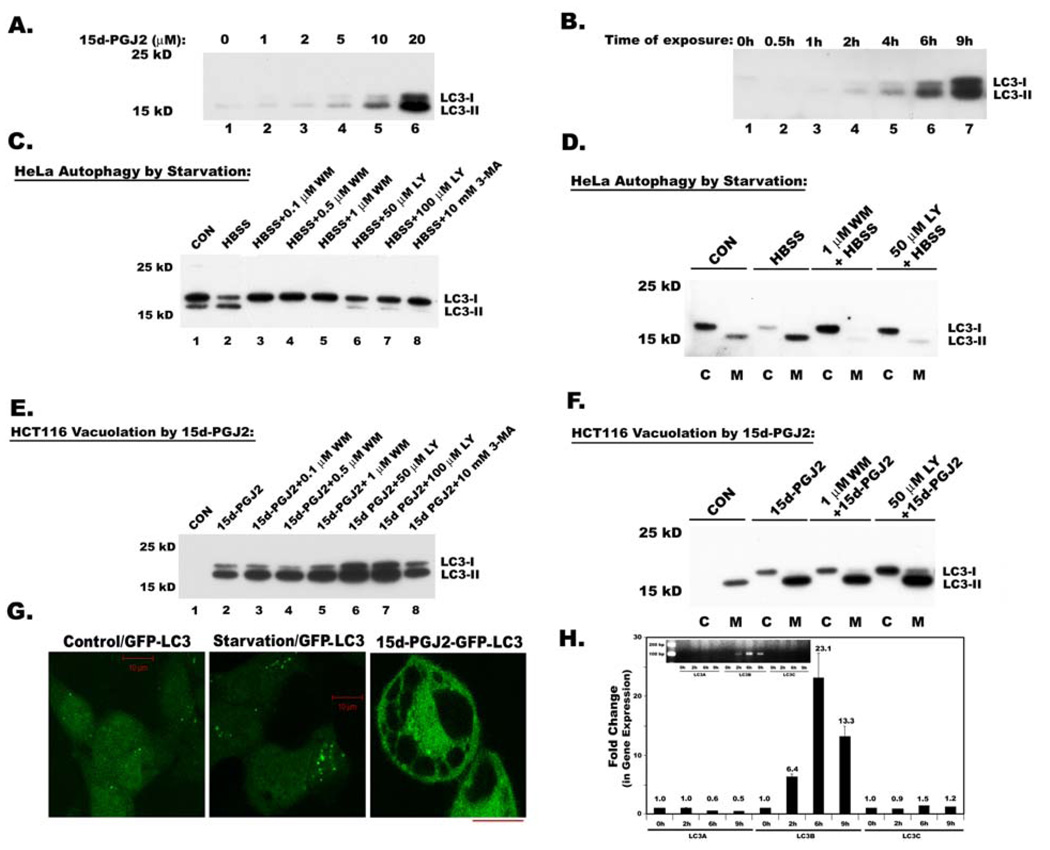
Figure 5. Expression and processing of autophagy marker, Map1 LC3 in serum starved HeLa cells and 15d-PGJ2 treated HCT116 cells.
Total cell lysates were analyzed for Map1 LC3 (LC3) expression by immunoblotting A. Immunoblot analysis of dose dependent expression of LC3 in 15d-PGJ2 treated HCT116 cells at different doses for 9h. B. Immunoblot analysis of time dependent expression of LC3 in HCT116 cells after treating with 20 µM of 15d-PGJ2. C. Immunoblot analysis of LC3 in whole cell lysates of HeLa cells that were serum starved to induce autophagic processing of LC3. Effect of PI3-Kinase inhibitors LY294002 (LY), Wortmannin (WM) and 3 Methyl-adenine (3-MA) on starvation induced LC3 processing. D. Immunoblot analysis of LC3 in cytosolic (C) and membrane (M) fractions of Hela cells and effect of PI3Kinase inhibitors. E. Immunoblot analysis of LC3 in whole cell lysates during 15d-PGJ2 induced cytoplasmic vacuolation and effect of PI3-Kinase inhibitors LY294002 (LY), Wortmannin (WM) and 3 Methyl-adenine (3-MA) on 15d-PGJ2 induced LC3 expression and processing. F. Immunoblot analysis of LC3 in cytosolic (C) and membrane (M) fractions of 15d-PGJ2 treated HCT116 cells and effect of PI3K inhibitors. G. HCT116 cells that are constitutively expressing GFP-LC3 were exposed to starvation or 15d-PGJ2 and were analyzed by confocal microscopy. The bar in these diagrams indicates 10 µ length. H. Quantitative real time PCR to analyze the expression of three isoforms of MAP1 LC3 using primers described in the Materials and Methods section. Insert shows relative expression of LC3 isoforms analyzed by agarose gel electrophoresis after 17 cycles of RT-PCR.

