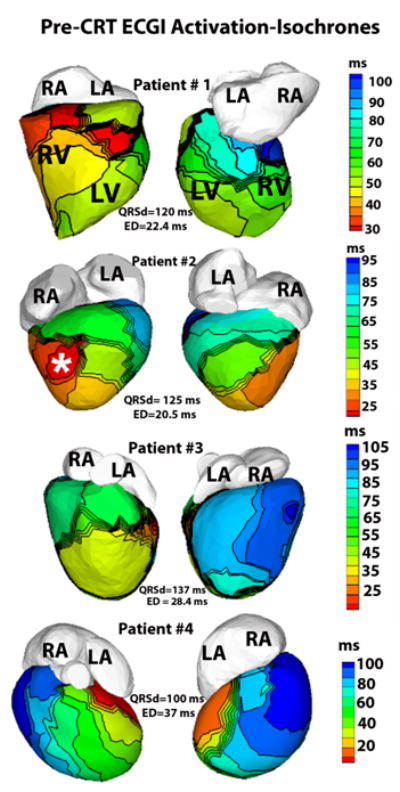
Figure 1.

ECGI activation-isochrones in Patients #1-4 for pre- implant evaluation. Left panel of each row shows the anterior view and the right panel shows inferior view. The isochronal lines on the epicardial surface are depicted in black. Activation maps are constructed during sinus rhythm in patients #1, 3 and 4 and during epicardial dual chamber pacing in Patient #2. White asterisk (second row) shows the location of the tip of the epicardial pacing lead, digitized from CT images. LA-left atrium, RA-right atrium, LV-left ventricle, RV-right ventricle.
