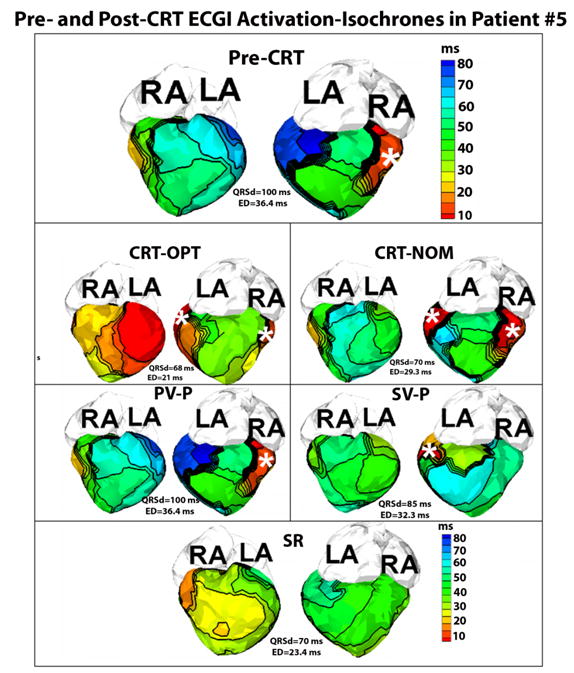
Figure 2.

Pre- and Post-CRT ECGI activation-isochrones in Patient #5. Each panel shows the anterior view (left) and the inferior view (right) of the epicardial surface activation map. The top panel shows the pre-CRT activation map during epicardial DDD pacing (pacing site marked by asterisk). Latest activation (dark blue, right, top panel) is observed in the basal posterolateral area of the systemic right ventricle and this area was chosen as the site for implanting the resynchronization lead. Panels CRT-OPT,CRT-NOM, PV-P, SV-P and SR show the ECGI activation-isochrones of the same patient, six months after the implant during optimized CRT pacing, nominal CRT pacing, pacing from the pulmonary LV lead only, pacing from the systemic RV resynchronization lead only, and sinus rhythm (SR), respectively. The epicardial pacing sites are marked by white asterisks.
