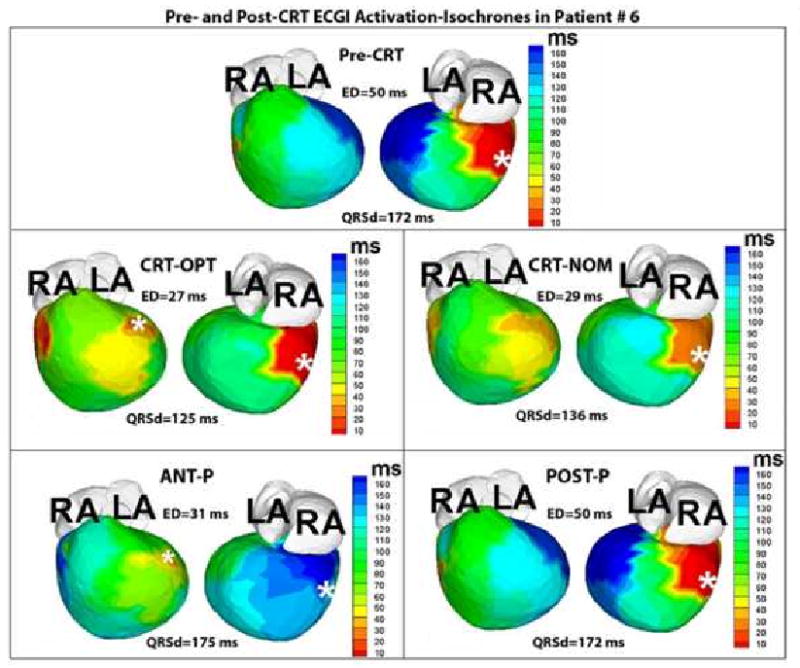
Figure 3.

ECGI activation maps from Patient #6 pre- and post-CRT. The map in the top panel is obtained during dual chamber paced rhythm (pacing site indicated by the white asterisk). The area of latest activation (dark blue, right, top panel) was localized to the mid lateral segment. The following panels are obtained in CRT-OPT, CRT-NOM, ANT-P, and POST-P conditions, with the white asterisks denoting sites of pacing leads.
