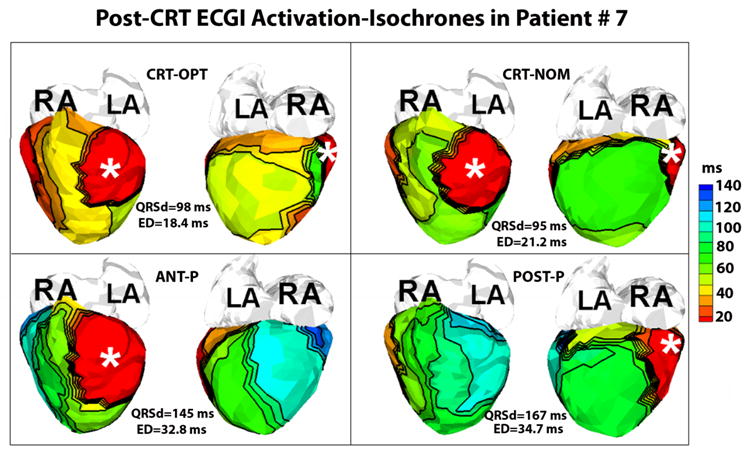
Figure 4.

Post-CRT ECGI activation isochrones in Patient #7 with two epicardial leads (white asterisks). Each panel shows the anterior (left) and inferior (right) views of the epicardial surface activation-map. Panels CRT-OPT, CRT-NOM, ANT-P and POST-P show the epicardial activation-isochrones during optimized CRT pacing, nominal CRT pacing, pacing from the anterior lead alone and pacing alone from the posterior lead alone, respectively. The optimized CRT settings yield the lowest electrical dyssynchrony (ED) index (or maximal synchrony of ventricular activation).
