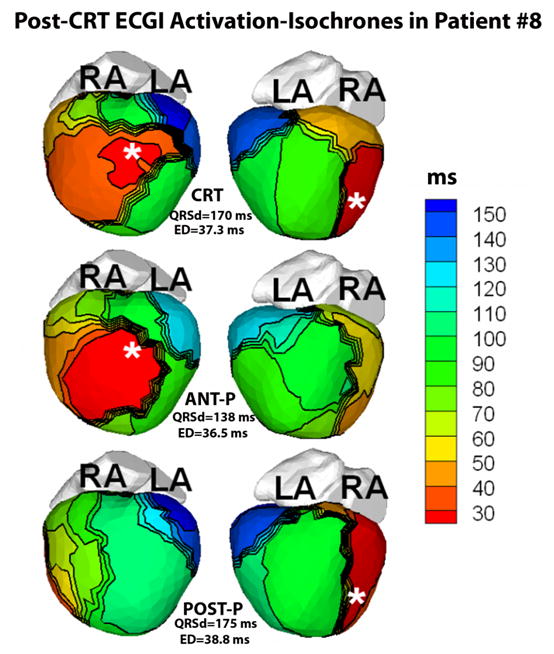
Figure 5.

ECGI imaged activation isochrones in Patient #8 during CRT pacing (top row, CRT), pacing from the anterior lead only (second row, ANT-P) and pacing from the inferior lead only (third row, POST-P). Each row shows the anterior (left) and inferior (right) views of the epicardial surface activation-map. White asterisks mark the location of the epicardial pacing leads. Crowded isochrones indicate slow conduction and thick black lines indicate conduction block. The identical pattern of delayed activation (in blue, green) of the left lateral wall and the inferior region (right) in all three pacing modes indicates that a major target area of the ventricle is non-responsive to pacing. Three months later, the patient underwent a heart transplant and was reported to be in a stable and satisfactory condition.
