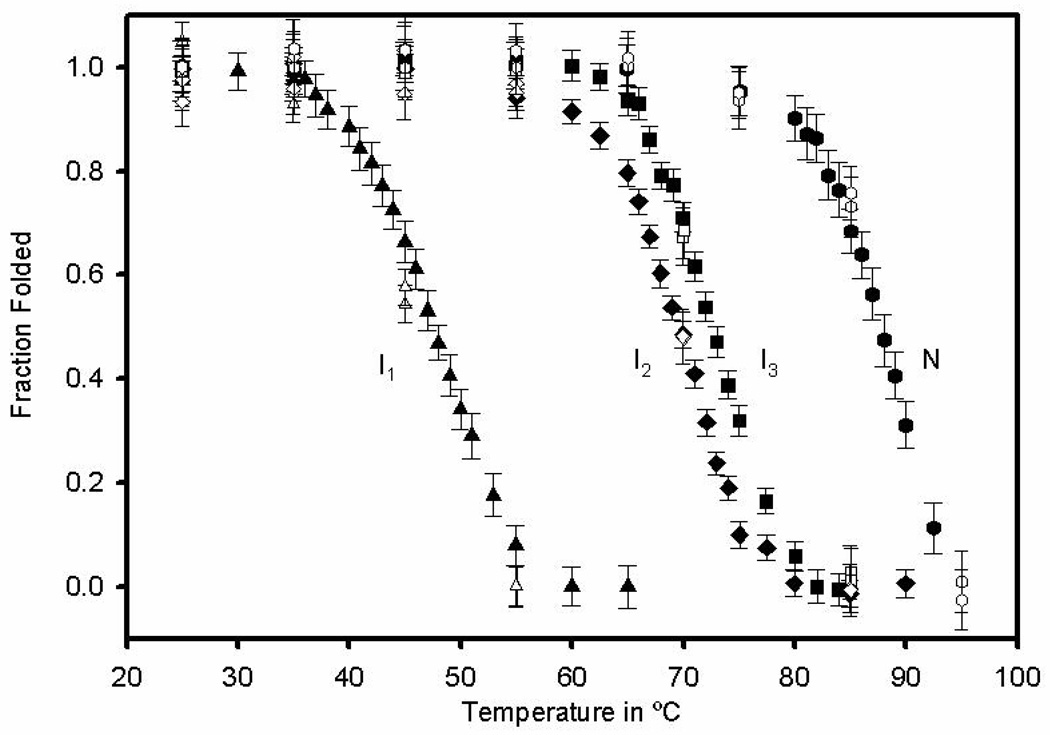
Figure 11.
Temperature denaturation at pH 3.0 of different species populated along the oxidative folding pathway. I1 – AEMTS blocked (triangles). I2 – AEMTS blocked (diamonds). I3 – AEMTS blocked (squares). N-ONC (hexagons). Unfilled characters correspond to heating and cooling curves of each of the species.

