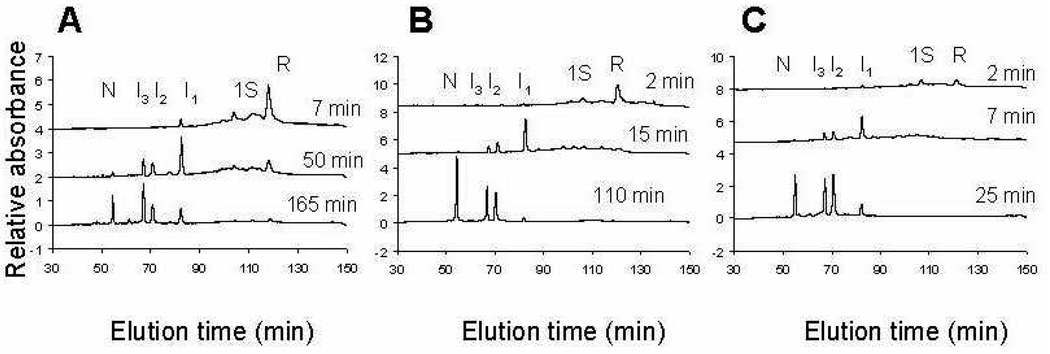
Figure 3.
Different distributions of intermediate species under different conditions. Panel A: 25 mM DTTox and 66 µM DTTred, 25 °C and pH 8.0 at 7, 50, and 165 min into the oxidative folding process. Panel B: 25 mM DTTox without DTTred, 25 °C and pH 8.0 at 2, 15, and 110 min into the oxidative folding process. Panel C: 70 mM DTTox without DTTred, 25 °C and pH 8.0 at 2, 7 and 25 min into the oxidative folding process.

