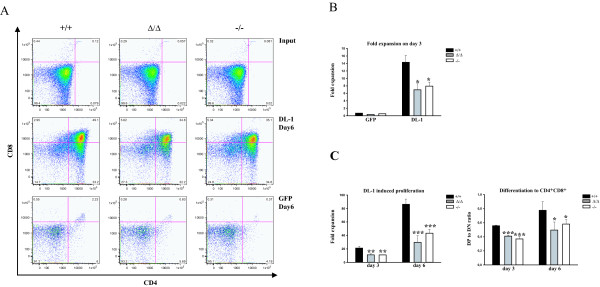
Figure 4.
SLY1-targeted DN thymocytes exhibit impaired proliferation and differentiation when cultured on OP9 DL-1 cells. A. CD4 and CD8 FACS profiles of sorted DN thymocytes before cultivation (input, upper row), and after cultivation for six days on OP9 DL-1 (middle row) or on OP9 GFP control cells (lower row). B. DL-1-dependent expansion of DN thymocytes after three days culture. C. Fold expansion on day three and day six (left panel). Differentiation rate (right panel) corresponds to the percentage of DP cells divided by the percentage of remaining DN cells. The expansion rate was determined by counting triplicates and comparing to initial seeding numbers on day 0. Representative data of at least three independently performed experiments is shown. *p ≤ 0.05; **p ≤ 0.005; *** p ≤ 0.001.

