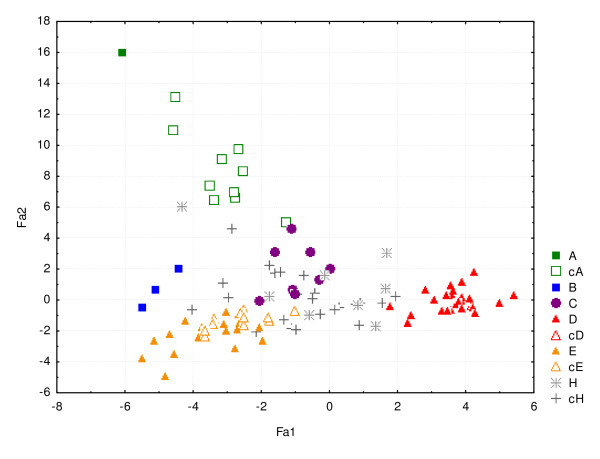
Figure 4.
Principal component analysis of wild and cultivated C. canephora accessions based on their SSR polymorphism. The first axis represents 10% of the variation and the second one represents 6.5% of the variation. The wild C. canephora accessions are represented by colored symbols (A, B, C, D, E). The cultivated accessions assigned to wild genetic groups are represented by empty corresponding symbols (cA, cD, cE). The individuals identified as putative hybrids are represented by a cross mark, H for the wild accession and cH for the cultivated ones.

