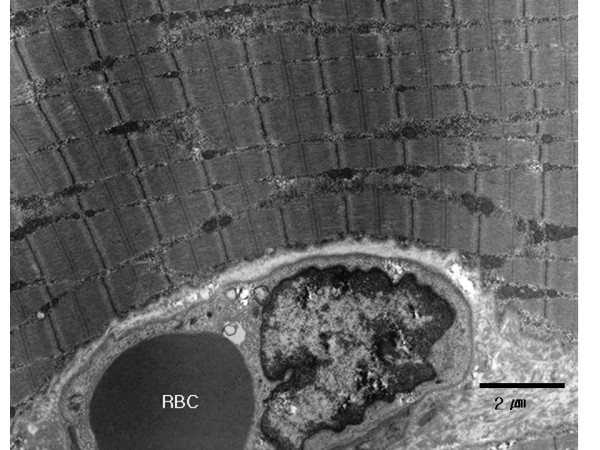
Figure 3.

Electron micrograph of skeletal muscle obtained from the adductor magnus of the ipsilateral thigh in a rabbit in the saline group (original magnification × 4000). An endothelial cell and an intraluminal red blood cell (RBC) is seen at the bottom of the image. Longitudinal section of the muscle shows orderly arranged A bands and Z lines. No interstitial edema or disruption of the endothelium is noted. bar: 2 μm
