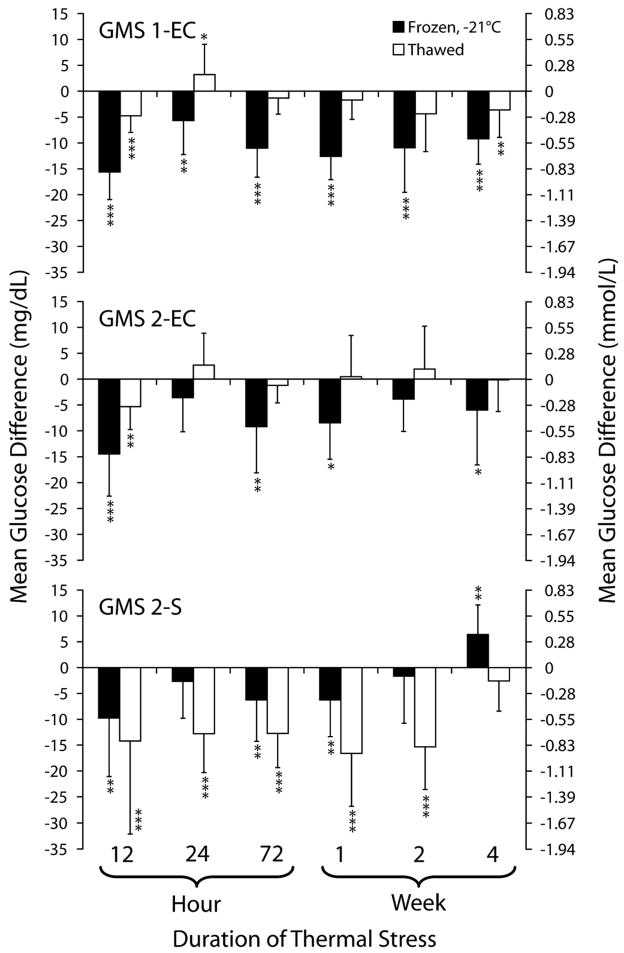
FIGURE 2.
Effects of freezing and thawing on glucose meter system (GMS) test strip results. This figure shows mean glucose difference between frozen or thawed test strips relative to control. Test strips were cold stressed at −21°C. Controls were stored and measured at room temperature (21°C). *P < 0.05. **P < 0.01. ***P < 0.001. Reprinted with permission from Knowledge Optimization, Davis, CA

