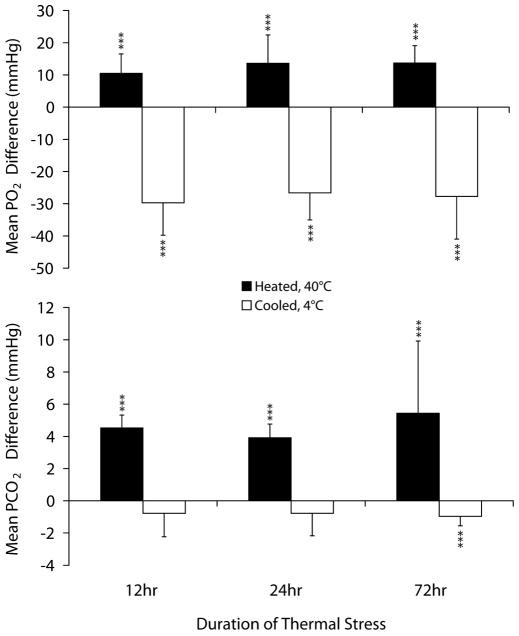
FIGURE 3.
Effects of heating and cooling of test cartridges on PO2 and PCO2 results obtained with a handheld blood gas analyzer. This figure shows the mean PO2 and PCO2 paired-differences between heated (40°C) or cooled (2°C) test cartridges and control (21°C). *P < 0.05. **P < 0.01. ***P < 0.001. Reprinted with permission from Knowledge Optimization, Davis, CA

