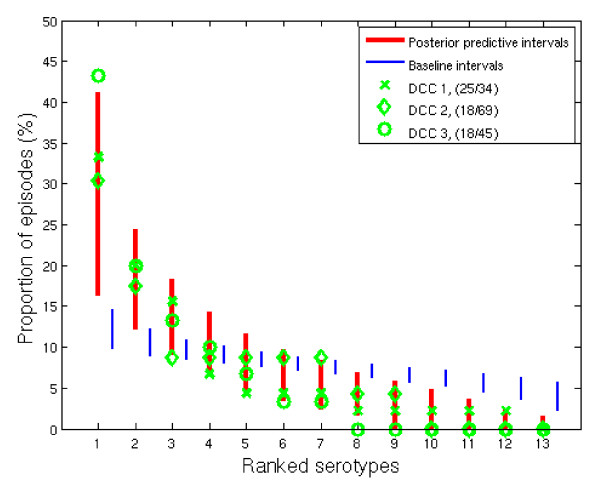
Figure 1.
Model validation. The cross, diamond, and circle present the observed proportions in the attendees in the three day care centres. The proportions are ranked in ascending order. The thick lines denote the 90% posterior predictive intervals of the ranked proportions, calculated from a sub-sample of 20 day care attendees. The narrow lines are based on episodes with random serotypes, showing the "baseline" distribution that results from ranking only. The posterior predictions were based on 1000 simulations of a day care centre cohort consisting of 50 day care attendees and their family members. The size of the three DCCs as the number of day care attendees together with the number of participating attendees is given in the parenthesis.

