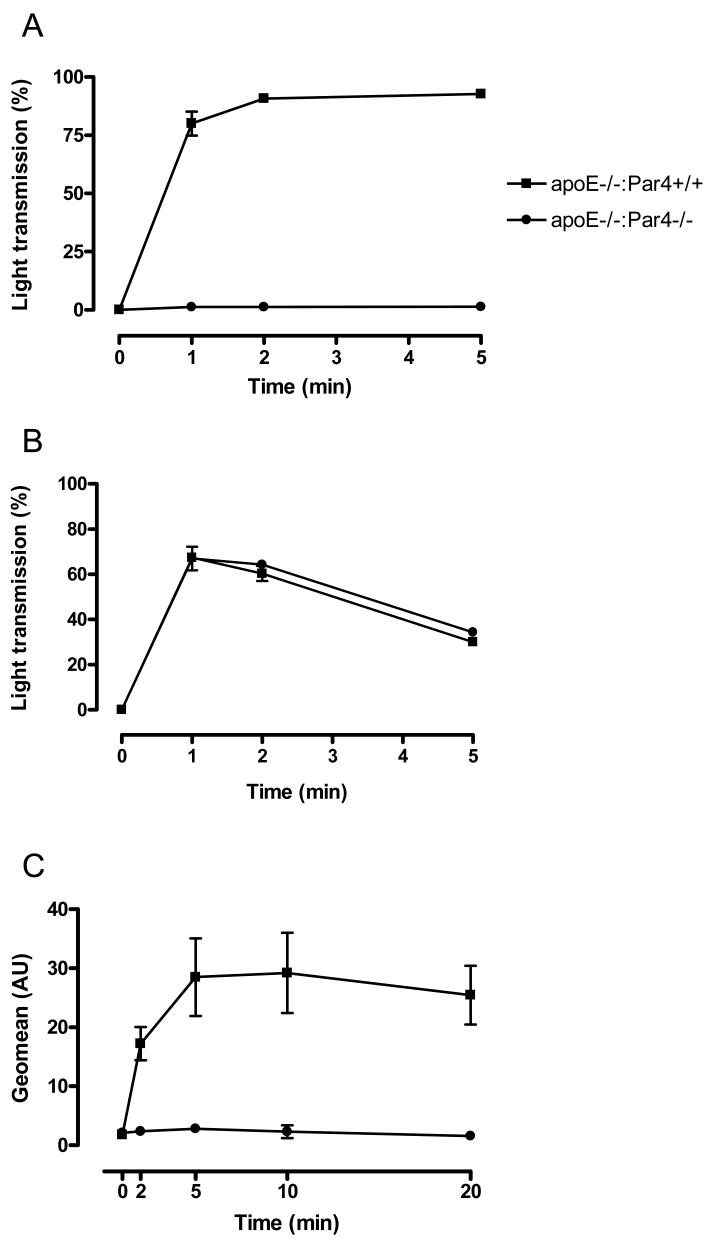
Fig. 1. Platelet functional analyses.
Platelets were isolated from littermate ApoE-/- mice that were either Par4+/+ or Par4-/-. Shown are platelet aggregations in response to A: thrombin (10 U/mL; N = 4) and B: ADP (10 μm; N = 6), and C: platelet exposure of P-selectin in response to thrombin (10 U/mL; N = 3). All data are mean ± sem.

