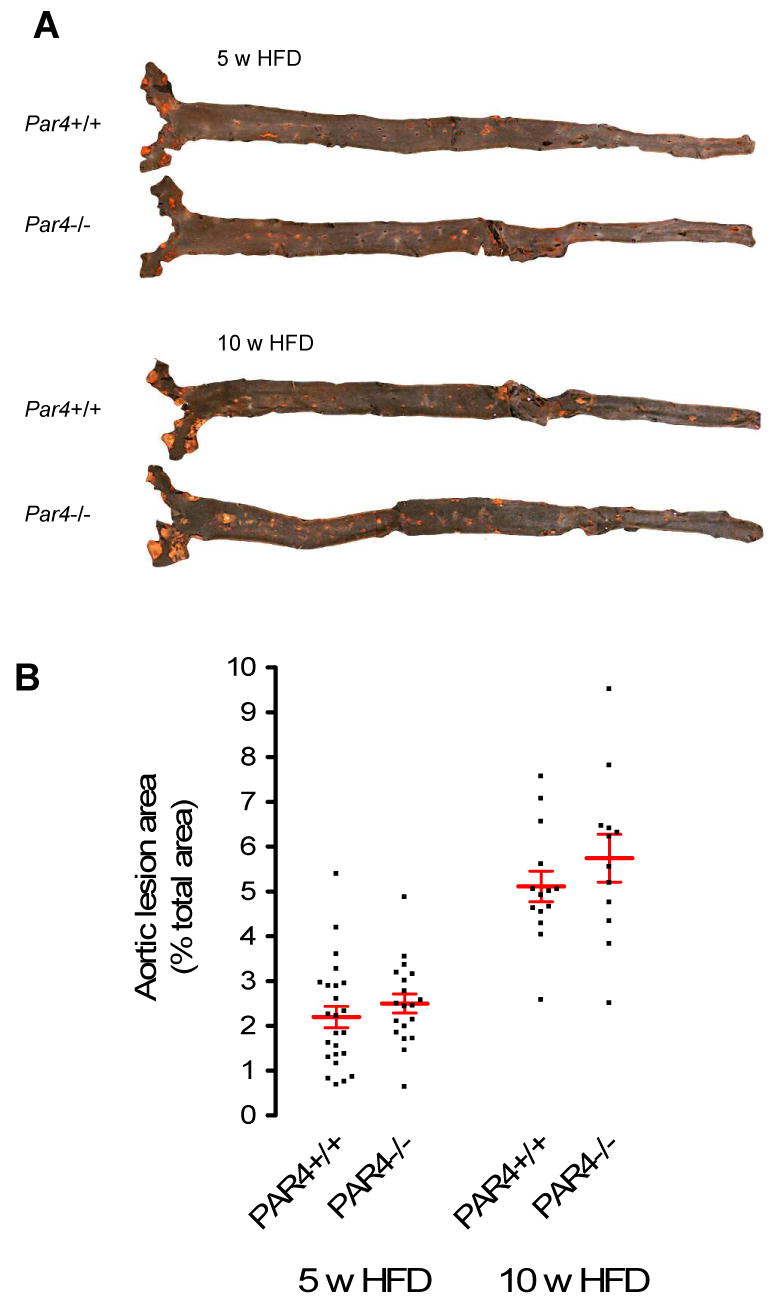
Fig. 2. Coverage of the lumenal surface of the aorta with atheroma.

Littermate ApoE-/- mice that were Par4+/+ or Par4-/- were maintained for 5 or 10 weeks on high fat diet before aortae were analyzed. A: Representative en face images of Sudan IV stained aortae. Red represents Sudan IV-positive lipid deposits. B: Percent aortic lumenal surface occupied by Sudan IV-positive lesions. Individual data points, each representing an individual mouse, are shown. HFD = High fat diet (21% fat, 0.15% cholesterol). Bars are mean ± sem. N = 19-24.
