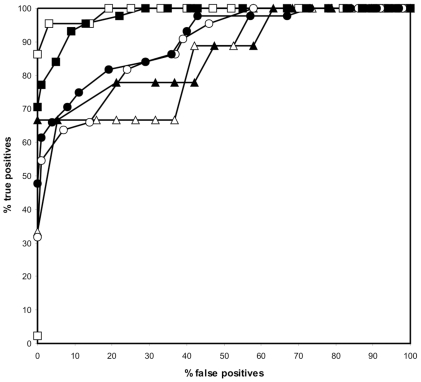
Figure 5. ROC curves representing the performance of the different predictors generated after running the learning set training algorithm.
The graph visualizes the not cross-validated sequence-based predictor (open square), the not cross-validated sequence and structure-based predictor (closed square), the cross-validated sequence-based predictor (open circle), the cross-validated sequence and structure-based predictor (closed circle), the sequence based predictor on the independent validation set (open triangle) and the sequence and structure-based predictor on the independent validation set (closed triangle).

