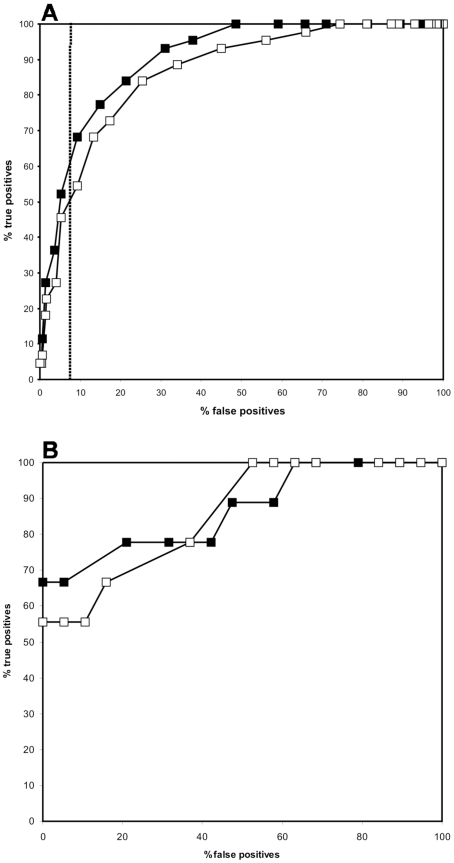
Figure 7. ROC performance comparison with a previously published algorithm.
A: Comparison of our DnaK predictor (closed square) with the previously published predicting algorithm from Rüdiger et al [3] (open square) for the extended benchmark peptide set. The data point above 90% specificity (90.7%) with the best MCC in both predictors is shown as a dashed line. B: ROC curves comparison between our predictor (closed square) and the algorithm of Rüdiger et al (open square) for the validation set of peptides.

