
Figure 4.
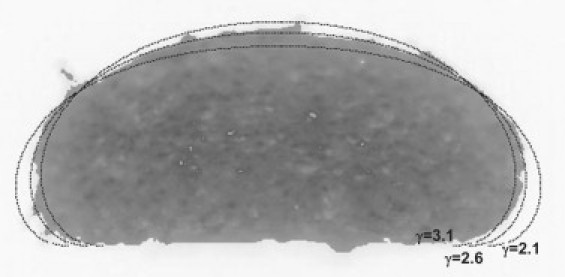
Different Laplacian curves with different surface tensions (2.1, 2.6, and 3.1 mJ/m2) superimposed on a sample cell aggregate. The value of surface tension obtained from the numerical method was 2.6 mJ/m2.
Official websites use .gov
A
.gov website belongs to an official
government organization in the United States.
Secure .gov websites use HTTPS
A lock (
) or https:// means you've safely
connected to the .gov website. Share sensitive
information only on official, secure websites.
Different Laplacian curves with different surface tensions (2.1, 2.6, and 3.1 mJ/m2) superimposed on a sample cell aggregate. The value of surface tension obtained from the numerical method was 2.6 mJ/m2.