
Figure 5.
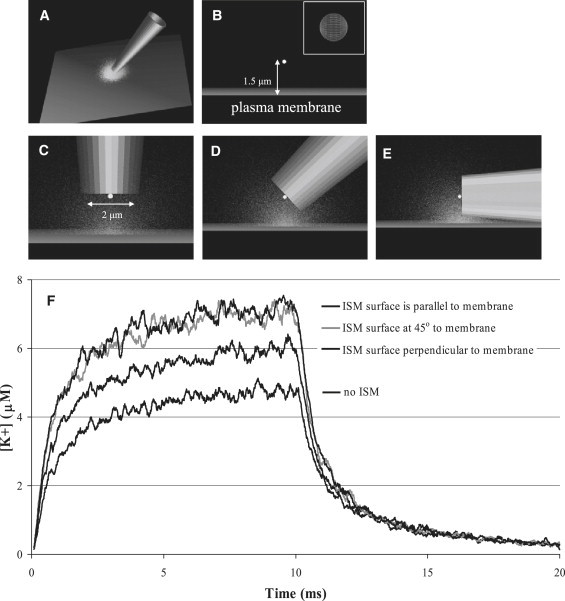
Diagram of the working ion-trap model and resultant [K+] profiles for different configurations of the K+-selective microelectrode. (A) Expanded view of the rendered microelectrode near the cell surface during the middle of K+ efflux through an open channel. (B) Side view of the small sampling region (white sphere, expanded in inset) used to determine the [K+] profile in the absence of the microelectrode. (C–E) Side views of the sampling region when the microelectrode active surface is parallel, at a 45° angle, and perpendicular to the plasma membrane surface. (F) The calculated [K+]-profiles for the different configurations of the microelectrode indicate the highest amount of ion trapping when the active surface of the microelectrode is parallel and at a 45° angle to the cell surface.