
Figure 2.
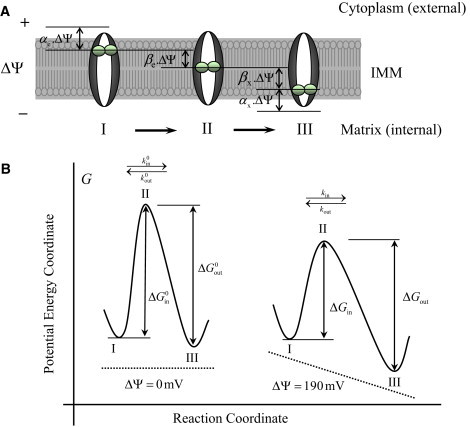
Free-energy barrier formalism for Ca2+ transport into mitochondria via the Ca2+ uniporter. (A) (I–III) Consecutive states of the Ca2+-bound uniporter functional unit in the process of Ca2+ translocation that is used to derive the dependence of the rate of Ca2+ transport on the electrostatic membrane potential ΔΨ. Here, αe is the ratio of the potential difference between Ca2+ bound at the site of uniporter facing the external side of the IMM and Ca2+ in the bulk phase to the total membrane potential ΔΨ, αx is the ratio of the potential difference between Ca2+ bound at the site of uniporter facing the internal side of the IMM and Ca2+ in the bulk phase to the total membrane potential ΔΨ, βe is the displacement of external Ca2+ from the coordinate of maximum potential barrier, and βx is the displacement of internal Ca2+ from the coordinate of maximum potential barrier. (B) Potential energy barrier profile along the reaction coordinate that is used to derive the dependence of the rate of Ca2+ transport on the electrostatic membrane potential ΔΨ. The dashed line shows the profile of the potential created by the electric field of the charged membrane. The points I, II, and III correspond to the Ca2+-bound uniporter states depicted in the upper panel A. The rate constants kin and kout are related to the changes in potential energy (Gibbs free-energy) ΔGin and ΔGout. Note that in the absence of electric field (ΔΨ = 0 mV), the heights of the free-energy barriers in the forward and reverse directions are equal when the dissociation constants for the binding of the external and internal Ca2+ to the uniporter are equal: that is, if and only if .