
Figure 1.
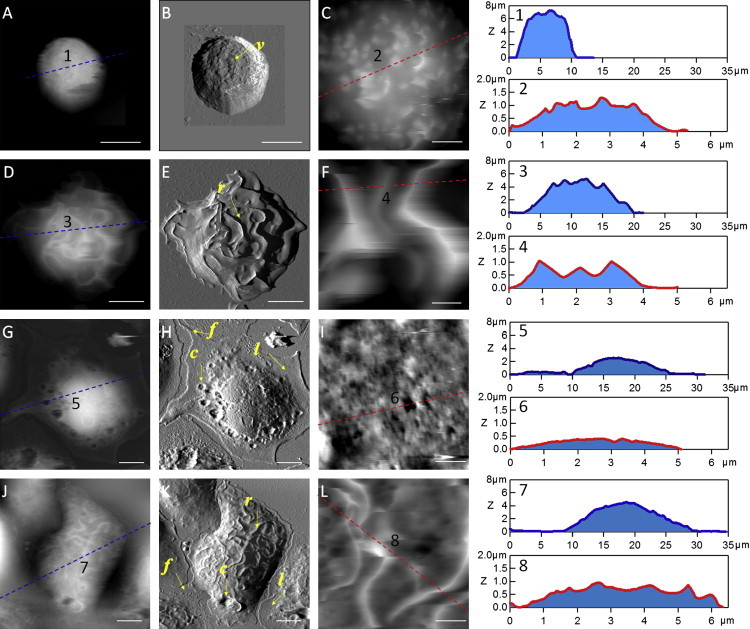
AFM images reveal characteristic 3D membrane morphologies for BMMCs under various sample preparation conditions. (A) AFM topograph of a BMMC−/−/−. (B) The corresponding deflection image of A. (C) A 5 μm × 5 μm zoom-in image from the top of the cell. Cursor profiles as indicated in A and C are shown on the right. The layout for the rest of rows is the same as for the top, except that the subject cells are a BMMCIgE/DNP(s)/−, BMMC−/−/PL, and BMMCIgE/DNP(c)/PL, respectively. Scale bars: (A, B, D, E, G, H, J, and K) 5 μm; and (C, F, I, and L) 1 μm. Local structures (villi, ridge, lamellopodia, filopodia, and crater) are indicated by letters (v, r, l, f, and c, respectively).