
Figure 10.
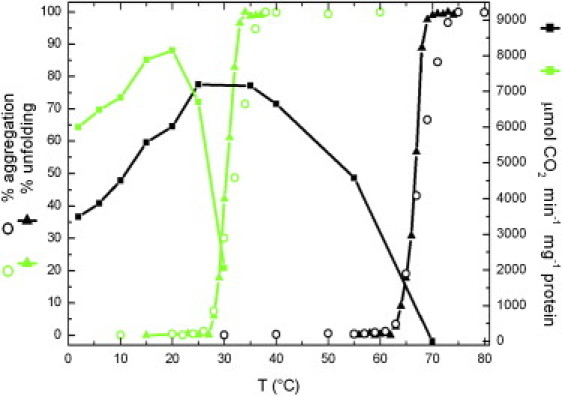
Unfolding, aggregation, and activity dependence of Ice-CA (green) and BCAII (black) as a function of temperature. Thermal unfolding (left axis) was recorded by intrinsic fluorescence for Ice-CA and BCAII. Thermally induced aggregation (left axis) was monitored by DLS. The specific activity of the enzymatic reaction, expressed as μmol CO2 min−1 mg−1 protein (right axis), was measured in saturating substrate conditions.