
Figure 1.
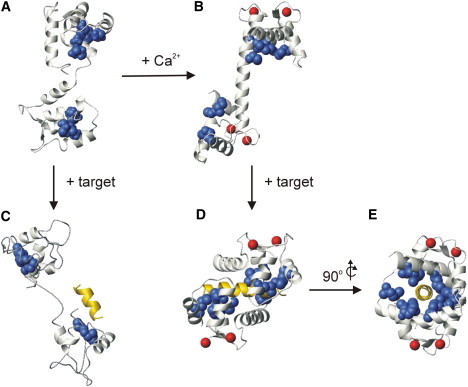
CaM structures and target interactions. (A) Apo-CaM (PDB:1DMO), (B) Ca2+-CaM (PDB:1CLL), (C) apo-CaM in complex with the SK channel CaM binding domain peptide (PDB:1QX7), (D) Ca2+-CaM in complex with the smMLCKp peptide (PDB:1CDL), and (E) 90° y-axis rotation of panel D. In each panel CaM is shown in ivory ribbon representation, the Met side chains are shown as navy blue space-fill representation, Ca2+ ions are represented by red spheres, and the bound target peptides are shown in yellow ribbon representation. CaM is oriented with the N- and C-domains on the top and the bottom, respectively, in each panel. Note that electron density was observed only for apo-CaM residues 5–72, 81–89, 97–101, and 116–146 in panel C.