
Figure 4.
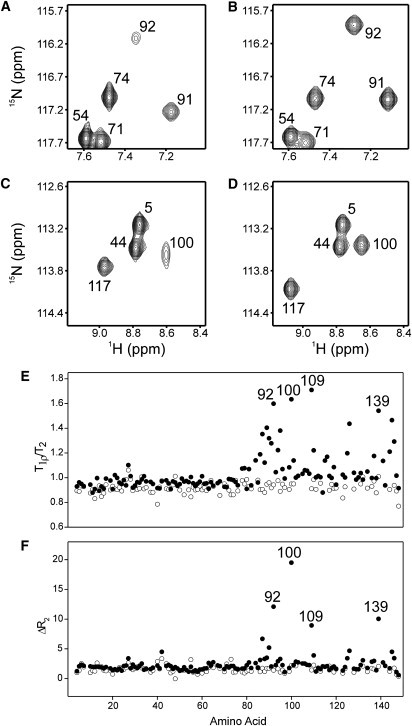
NMR investigation of slow conformational exchange in apo-wt-CaM and apo-CT-CaM. Panels A and C show selected regions of the 1H, 15N HSQC NMR spectrum of apo-15N-wt-CaM, and panels B and D show the same regions of the apo-15N-CT-CaM spectrum. (E) Ratio of the 15N T1ρ and T2 values plotted versus amino acid residue for apo-wt-CaM (•) and apo-CT-CaM (○). (F) ΔR2 values (where ΔR2 = R2(τcp = 5 ms) – R2(τcp = 1 ms), and R2 = 1/T2), plotted versus amino acid residue for apo-wt-CaM (•) and apo-CT-CaM (○).