
Figure 5.
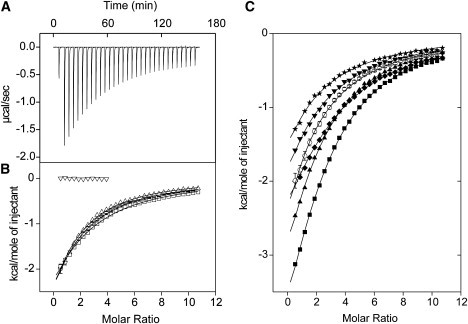
ANS binding to Met-substituted CaM proteins as monitored using ITC. (A) Baseline-corrected raw calorimetric data for the sequential injection of 5 mM ANS into 50 μM Ca2+-wt-CaM at 25°C. (B) Integrated heat signals (corrected for heat of dilution effects) are plotted as a function of molar ratio for ANS titrations of apo-wt-CaM at 25°C (▿), or Ca2+-wt-CaM at 20°C (▵), 25°C (○), or 30°C (□). (C) Integrated heat signals plotted as a function of molar ratio for ANS titrations of Ca2+-wt-CaM (○), Ca2+-SeMet-CaM (▾), Ca2+-Eth-CaM (★), Ca2+-Nle-CaM (♦), Ca2+-CT-CaM (▪), and Ca2+-SeMet-CT-CaM (▴), each performed at 25°C. The solid lines through the data represent the best fit using the “one set of sites” model supplied in the MicroCal Origin software. The data for Ca2+-wt-CaM at 25°C in panels B and C are shown as the average, with SD error bars derived from three independent titrations.