
Figure 5.
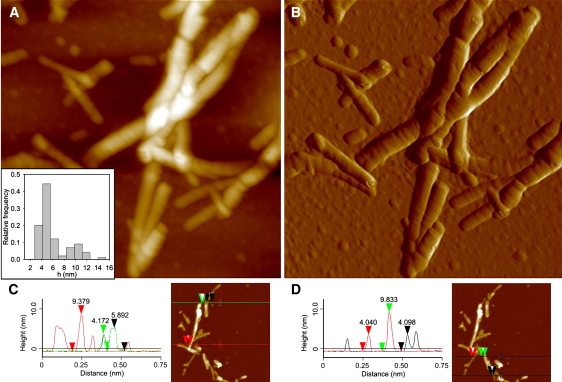
(A and B) TM-AFM image of aggregates formed by PDZ2. Aggregates were produced by incubating the protein domain at a concentration of 0.4 mg mL−1, in 20 mM sodium phosphate, 1 M NaCl, pH 7.0, 37°C, under agitation at 750 rpm for 24 h. (A) Height data (scan size 870 nm, Z range 30 nm); (inset) distribution of fibril height measured from cross sections of TM-AFM topographic images. (B) Amplitude data (scan size 870 nm; not quantitative in height), revealing the fibril ultrastructure in more detail. (C and D) Typical cross-section profiles of PDZ2 fibrils. Red, green, and black arrows facilitate the association between the topographic measurements (left) and the corresponding features in the TM-AFM images (right).