
Figure 9.
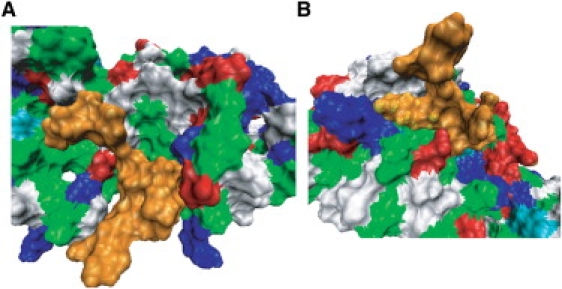
Intermolecular contact surfaces between Shc PTB domain and pY1114 (A), and Shc SH2 domain and pY1173 (B), represented in terms of their molecular surface. The averaged structure (during 1–2-ns period) obtained from 2-ns MD simulation is shown in each panel. pY-peptides are colored orange. Acidic and basic residues are colored red and blue, respectively. Nonpolar and polar residues are colored green and white, respectively.