
Figure 5.
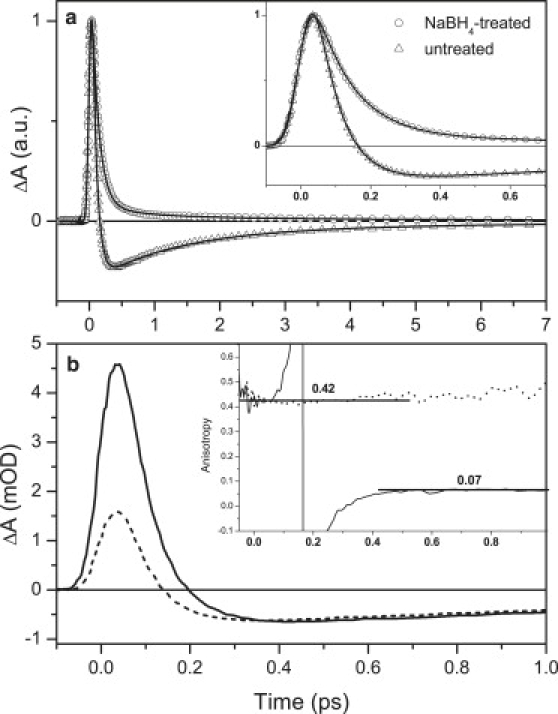
(a) Kinetics recorded at the maximum of stimulated emission of retinal chromophore, 900 nm, after excitation at 490 nm. Solid lines represent fits. (Inset) Enlargement of the initial part of the kinetics. (b) Kinetics measured at 900 nm for the untreated xanthorhodopsin with parallel (solid) and perpendicular (dashed) polarization with respect to the excitation at 490 nm. (Inset) Time evolution of anisotropy for untreated (solid line) and NaBH4-treated (dashed) xanthorhodopsin.